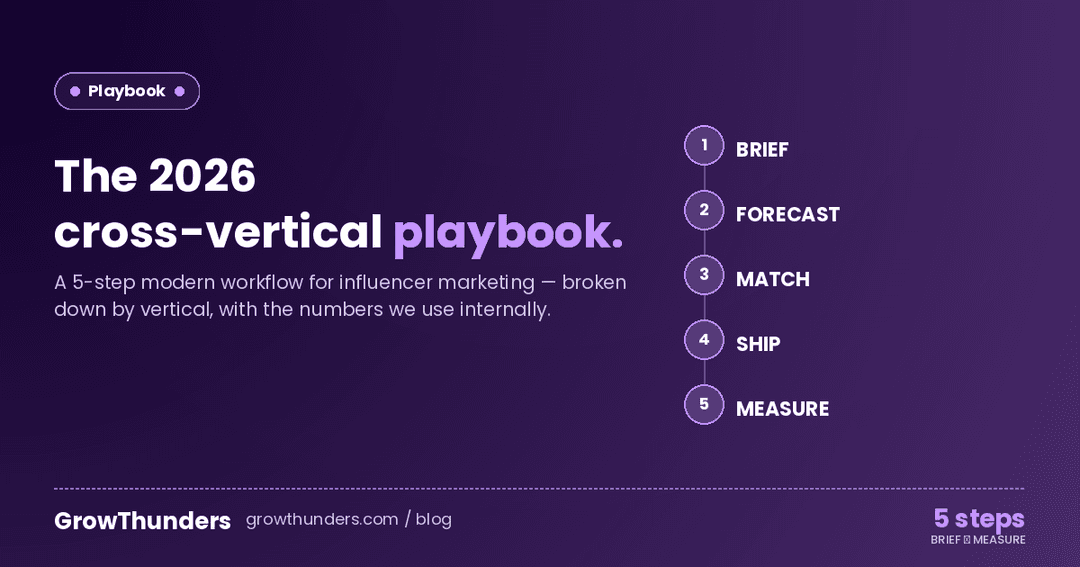

We've delivered 1,400+ influencer placements across 67 markets and 8 verticals. Total tracked media spend north of $8M. Every deal logged, every outcome attributed, every creator scored.
Here's what the data actually says — across mobile games, beauty, fashion, tech, automotive, food, lifestyle, and fintech. Not the agency-deck version. The operator version.
Pattern 1: Mid-tier dominates for conversion. Always.
Across every vertical, the 100k–500k follower band delivers the lowest blended CPA. Not the macro creators (>1M). Not the nano creators (<10k). The middle.
Specifically, across our dataset:
- Macro (1M+): highest absolute reach, but CPM 1.8–3.2x the mid-tier, and CPA 1.5–2.4x the mid-tier
- Mid-tier (100k–500k): CPA baseline = 1.0x
- Micro (10k–100k): CPA roughly 0.9–1.1x mid-tier, but with 3–5x the operational overhead per dollar spent
- Nano (<10k): CPA 0.7–1.3x mid-tier in some verticals, but you need 30+ to match one mid-tier in reach and your account management cost eats the savings
The mid-tier wins on the only metric that matters: CPA per operational dollar. Macro is for brand launches. Nano is for hyper-niche. The bulk of every budget belongs in the middle.
Pattern 2: The top 10% of creators in a vertical have outlier-low CPMs that don't scale
We see this constantly. A creator outperforms predicted CPA by 60%. Brand wants to "go all in." Agency says yes, books the next four months solid. CPA reverts to the vertical mean within two campaigns.
Why: outlier performance is usually a function of post-format novelty, momentary algorithmic favor, or a specific cultural moment. None of those scale linearly. The fourth campaign with the same creator is not the first campaign with the same creator. Audience fatigue is real and fast — typically observable within 3–4 posts to the same audience for the same brand.
The right move: when a creator outperforms, run them again at 1.5x volume, not 5x. Diversify. Save the relationship.
Pattern 3: Vertical-driven CPM dispersion is wider than country-driven CPM dispersion
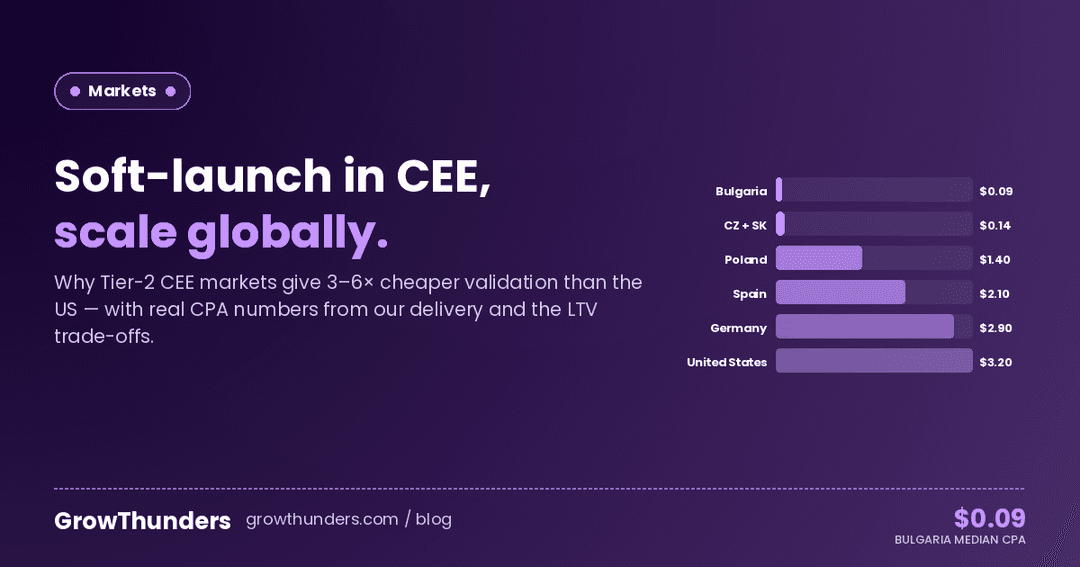
If you take a creator with 250k followers in the same country, the CPM gap between beauty and mobile games is roughly 4x at the median. The CPM gap between the same creator type in the US vs. Poland is roughly 2.2x.
Vertical > geography. Always. This means:
- If you're a multi-vertical brand (rare but it happens), expect wildly different unit economics per vertical
- If you're entering a new vertical, don't anchor on what worked in your old vertical's pricing. The market is not the same.
- Cross-vertical creators (a "lifestyle" creator who happens to do tech reviews) often get priced on whichever vertical their last deal was in. Useful arbitrage if you're paying attention.
Pattern 4: First-deal performance with a creator is not predictive of second-deal performance — unless you measure the right signal
The naive read: a creator's first campaign for you went well, so book them again. The data: first-deal CPA correlates with second-deal CPA at only r=0.34 across our dataset. Almost a coin flip.
What correlates much better (r=0.71) with second-deal performance: audience response quality during the first deal — specifically, comment quality, save-to-like ratio, and the shape of the engagement decay curve in the 72 hours after posting.
If the first deal had high likes but flat comments and a sharp engagement cliff at hour 12, the audience didn't actually care. That creator will not repeat the result for you. Likes are theater. Saves and comment threads are signal.
Pattern 5: Beauty has the longest payback window. Fintech has the shortest.
Across the data, time-to-attribution-payback by vertical:
- Fintech: median 9 days from post to attributed action
- Mobile games: median 14 days
- Food & beverage: median 18 days
- Tech / consumer electronics: median 26 days
- Fashion: median 31 days
- Beauty: median 42 days
- Automotive: median 67 days
If you're measuring beauty campaigns on a 14-day attribution window, you are seeing roughly a third of the actual return. Set your measurement window to the vertical's payback profile, not your reporting cadence.
Pattern 6: Creator-coded URLs convert 2–3x better than link-in-bio for the same creator
This one surprises people. On nearly identical content, creators who put a branded vanity URL in-caption or in-video ("go to brand dot com slash my-name") drive 2–3x the attributed conversions of creators who rely solely on link-in-bio. The audience trusts the spoken or written URL. The friction of link-in-bio is real and underweighted.
Build the vanity URL into every contract. It's a 5-second contract clause and a 200% conversion bump.
Pattern 7: The "perfect brief" is shorter than you think
Briefs above 800 words correlate with lower campaign performance in our dataset. Briefs in the 200–500 word range, with three constraints and one mandatory talking point, outperform.
The mechanism: long briefs produce content that sounds like ad copy. Short briefs preserve the creator's voice, which is the entire reason their audience is there. You are not buying access to followers. You are buying access to trust. Long briefs erode trust. Short briefs preserve it.
Pattern 8: Whitelisting beats native posting on cold audiences
A counterintuitive finding: when you whitelist a creator's content and run it as paid social to a cold audience (not the creator's followers), CPA is typically 30–55% lower than the equivalent paid social using brand-produced creative.
This is not because the creator's followers are converting. They're not — they're not in the audience. It's because creator-style content outperforms brand-style content on cold paid placements. The whitelisting unlocks a media-buying advantage independent of the creator's audience.
If you're not running whitelisting on at least 60% of your creator deals in 2026, you are leaving the largest free lever in performance marketing untouched.
Pattern 9: The creator marketing power law is steeper than people think
In our dataset, the top 20% of creators by performance generate roughly 71% of the attributed conversions. Not the top 50%. The top 20%.
This means roster discipline matters more than roster size. Most brands have too many creators in their stable and not enough budget concentrated on the ones that actually work. Re-rank quarterly. Cut the bottom third. Reinvest the saved budget into the top 20%.
Pattern 10: Cross-platform same-creator deals underperform single-platform
A creator who posts the same campaign on Instagram, TikTok, and YouTube typically delivers lower aggregate CPA than the same creator doing only their best-performing platform at higher volume. Why: each platform punishes obvious cross-posting algorithmically, and audience attention fatigues faster across formats than within them.
Pick the creator's best platform. Buy more units on it. Skip the cross-platform bundle even when it's "discounted."
The summary playbook
If you internalize five things from 1,400 placements, make it:
- Mid-tier wins on CPA. Concentrate budget there.
- Vertical drives price more than geography. Don't anchor across verticals.
- Comments and saves predict next-campaign performance. Likes don't.
- Match your attribution window to the vertical's payback curve.
- Whitelisting is the free money lever. Use it on every deal that allows it.
None of this is rocket science. It's just what the data says when you actually track 1,400 placements and read what they tell you.
Most brands don't track. Most agencies don't share the data back. That's the whole reason the category looks like luck instead of math.
It doesn't have to.