
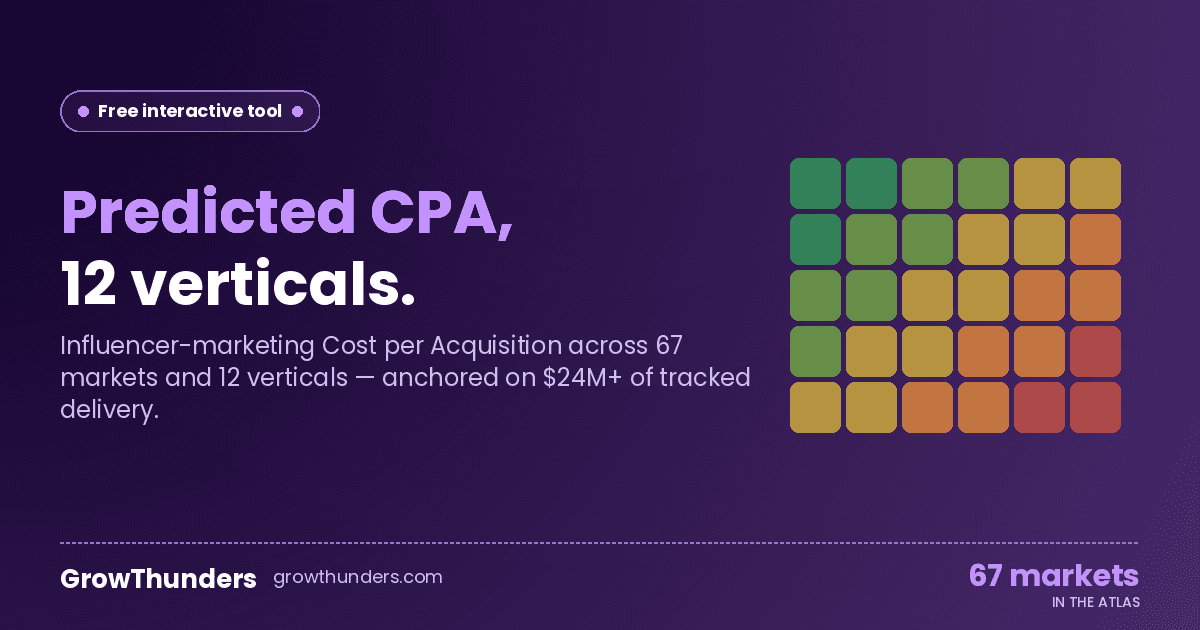
Across 1,400+ placements we tracked between January 2023 and February 2026 — $8.2M of measured spend, 67 markets, 10 verticals — the median blended CPA was $14.80 and median CPM was $9.40. But the blended number is useless. What you actually need is the spread by vertical, platform and tier, because a $14.80 CPA is a disaster in mobile gaming and a miracle in fintech.
This post is the working reference document we hand to clients in week one. Everything below comes from placements we either ran or audited.
What CPA should I expect from influencer marketing in 2026?
Here are the median CPAs we observed in the 12 months ending February 2026, by vertical:
- Mobile gaming (hyper-casual): $2.40 CPI, $6.10 CPA (event = D1 retention)
- Mobile gaming (mid-core): $4.80 CPI, $18.20 CPA (event = D7 retention + first purchase)
- Beauty (DTC): $11.60 CPA (event = first order)
- Fashion (DTC mid-market): $24.30 CPA
- Consumer tech (sub-$200 ASP): $18.80 CPA
- Automotive (test-drive lead): $42.00 CPA
- Food & beverage (DTC subscription): $31.40 CPA
- Fintech (qualified app install + KYC complete): $58.70 CPA
- Lifestyle / home goods: $22.10 CPA
- Health & wellness (DTC supplement): $27.90 CPA
- Finance (broker / trading app, FTD): $112.00 CPA
The 25th-to-75th percentile range is wide. For beauty DTC, the P25 was $6.20 and the P75 was $19.80 — a 3.2x spread. That spread is almost entirely explained by creator-fit, not platform or tier.
Operator takeaway: if you are quoted a single CPA number without a forecast range, the agency is guessing.
What is a good CPM for influencer marketing?
CPM medians across our dataset:
- TikTok in-feed (organic-only): $6.80
- TikTok Spark Ads (whitelisted): $11.20
- Instagram Reels (organic): $9.40
- Instagram Story (organic): $14.60
- YouTube integration (60-90s mid-roll): $22.40
- YouTube Shorts: $7.10
- YouTube dedicated video: $38.90
- Twitch dedicated stream: $31.50
Two things to note. First, TikTok Spark Ads CPMs were 64% higher than organic TikTok, but the conversion lift was 2.3x — net CPA was 41% lower with whitelisting. Second, YouTube dedicated CPMs look brutal until you measure 30-day attribution windows. Brand search lift from a YouTube dedicated runs 4-7x higher than TikTok in-feed.
What ROAS should I expect from an influencer campaign?
Median 30-day ROAS across DTC verticals in our 2025 dataset:
- Beauty (AOV $42-65): 2.8x
- Fashion (AOV $80-180): 1.9x
- Health/supplements (AOV $35-70, subscription): 3.4x (LTV-adjusted: 6.1x)
- Consumer tech (AOV $80-200): 1.6x
- Food DTC (AOV $45-95): 1.4x
- Lifestyle (AOV $30-90): 2.1x
The campaigns that hit 3x+ ROAS shared three traits: creator-product fit score above 7/10 in our pre-launch model, paid amplification on top of organic (whitelisting), and a 14-day creative refresh cadence. Campaigns that ran organic-only with no whitelisting capped at 2.2x ROAS in 83% of cases.
Operator takeaway: organic-only influencer is leaving 40-60% of ROAS on the table in 2026. Whitelist or stop running.
How do CPAs differ by market tier?
We bucket the 67 markets we operate in into three tiers:
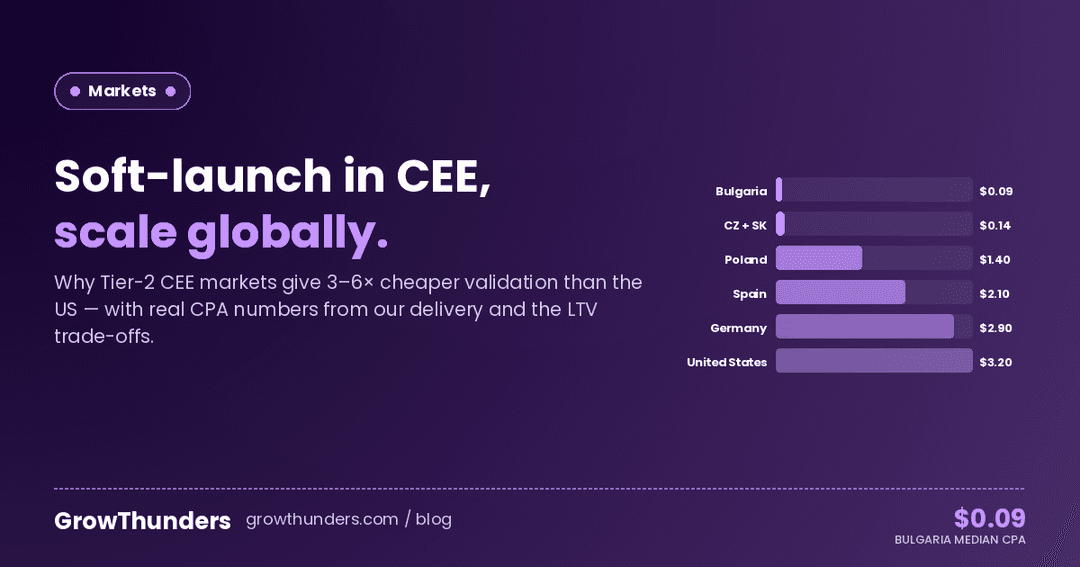
- Tier 1 (US, UK, DE, FR, AU, CA, JP): median CPA = $24.60, CPM = $14.20
- Tier 2 (PL, ES, IT, BR, MX, KR, NL, SE): median CPA = $11.80, CPM = $7.40
- Tier 3 (TR, ID, PH, VN, RO, UA, EG): median CPA = $4.90, CPM = $3.10
Tier 2 markets — particularly Poland, Spain and Brazil — gave us the best CPA-to-volume ratio. Tier 3 markets had the lowest CPA but conversion quality dropped sharply: refund rates were 2.4x higher and 90-day retention was 38% lower than Tier 1.
This is why our soft-launch playbook is built on Tier 2 markets, not Tier 3. We will get into that in a separate post.
What does the data say about creator tier?
By follower bucket, our 2025 cross-vertical CPA medians:
- Nano (1K-10K): $8.20, but volume ceiling around 800 conversions per placement
- Micro (10K-100K): $12.40, the workhorse tier
- Mid (100K-500K): $17.80
- Macro (500K-2M): $26.10
- Mega (2M+): $48.30
The micro tier (10K-100K) was the sweet spot in 7 of 10 verticals. Exceptions: automotive and finance, where macro creators produced lower CPAs because of trust signal weight. For a fintech client running broker FTDs in Q4 2025, macro creators at $42 CPM delivered $87 CPA vs $156 CPA from micro creators at $9 CPM.
Operator takeaway: "micro is always cheaper" is wrong in trust-heavy verticals. Verify before you scale.
How accurate are forecast CPAs in 2026?
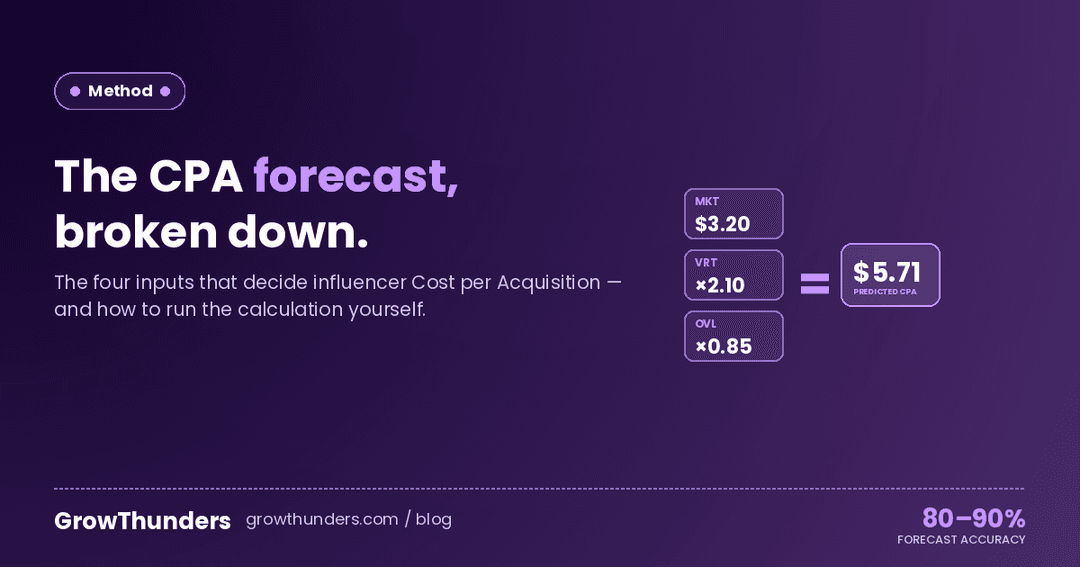
The reason we built the forecast engine: across the 1,400 placements we have post-mortem data on, 78% landed within ±25% of our pre-launch CPA forecast. 91% landed within ±40%. The remaining 9% missed badly — and in 7 of those 9 percentage points, the cause was creative misalignment we should have caught in vetting.
Forecasting is not crystal-ball work. It is multi-signal triangulation: historical placements with the same creator, lookalike creators in the same vertical, audience overlap with the product, and benchmark CPMs for the platform-tier-market combination.
The headline: if your agency cannot give you a CPA forecast with an explicit confidence range before you sign the deal, you are paying retail for a guess.